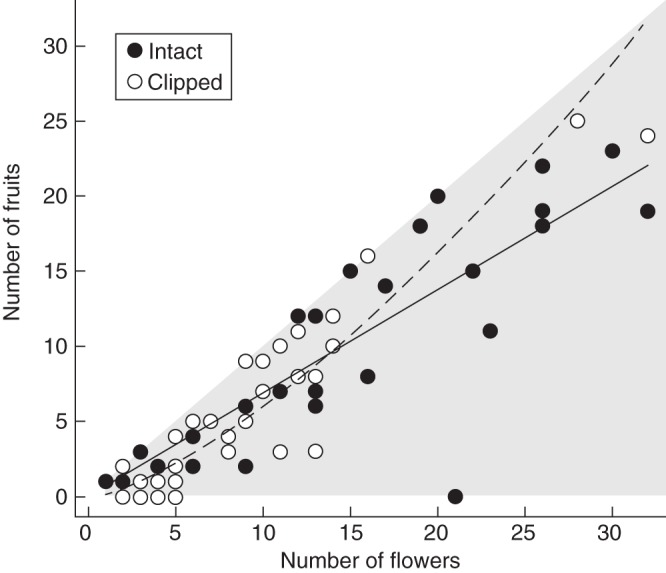
Fig. 4.

Relations between fruit production and the number of sampled fertile flowers for intact (solid symbols and solid line) plants and for plants from which the sterile flowers had been removed (open symbols, dashed line) in the Mallorcan population. The grey area depicts possible outcomes.
