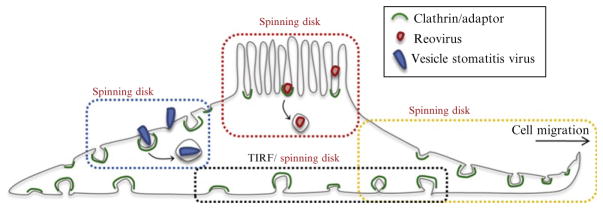
Figure 4.3.
Schematic representation of the imaging strategies used to follow the dynamics of clathrin-coat assembly in different regions of the cell. The drawing indicates the location of various regions imaged in different cell types: apical surface of polarized cells (red box), leading edge of migrating cells (yellow box), dorsal surface of nonpolarized cells (blue box), and adherent surface (black box).

