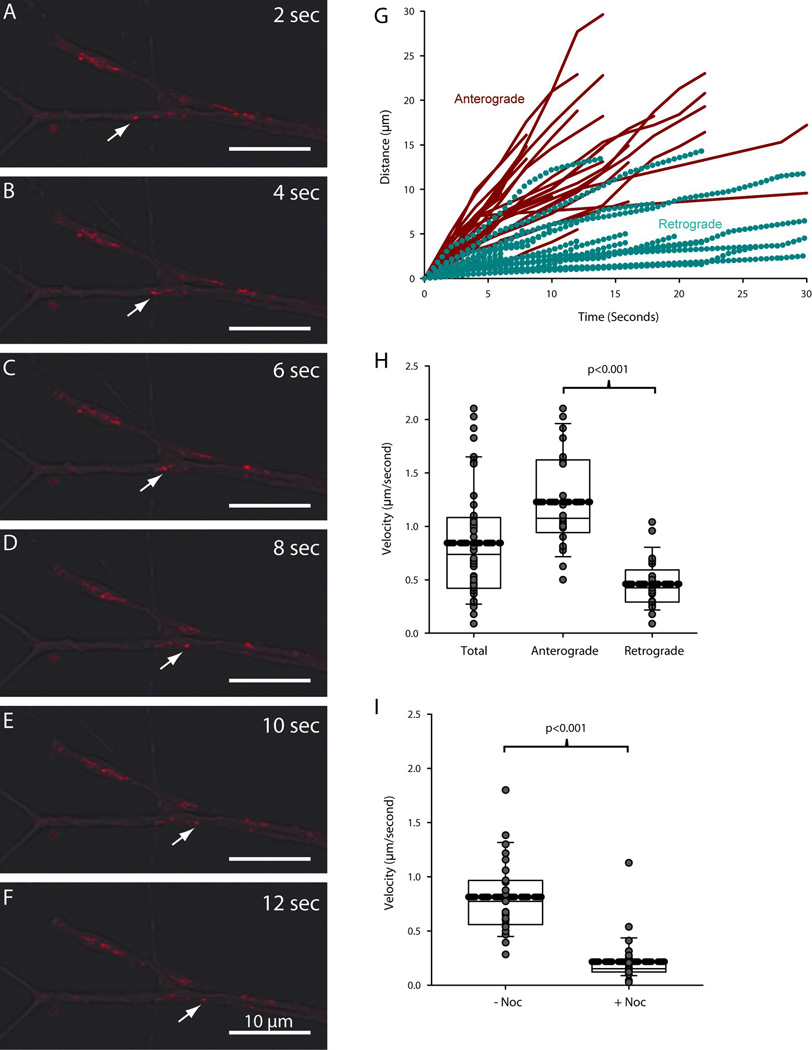
Figure 8. Lysosomes move retrogradely and anterogradely within the axons of sympathetic neurons.
Lysosome movement was tracked in the axons of SCG neurons to assess the impact of lysosome translocation on axonal protein degradation. (A–F) Lysosomes were observed to move bidirectionally in the terminals of SCG axons. White arrows indicate the retrograde movement of a single lysosome over the course of 12 seconds. Scale bar = 10µm. (G) Movement profiles for individual lysosomes were color-coded based on the direction of movement (red for anterograde and cyan for retrograde). Lysosomes segregated into two populations based on their movement profiles. (H–I) Average velocity was plotted for all lysosomes, those moving anterogradely and those moving retrogradely. Average velocity was also measured in the presence of nocodazole. Thick dashed lines represent the mean. Solid lines within the boxes represent the median with first (top and bottom of box) and second (whisker bar) standard deviations. Grey circles represent individual data points. P≤0.05 was considered to be significant by Student’s unpaired T-test.

