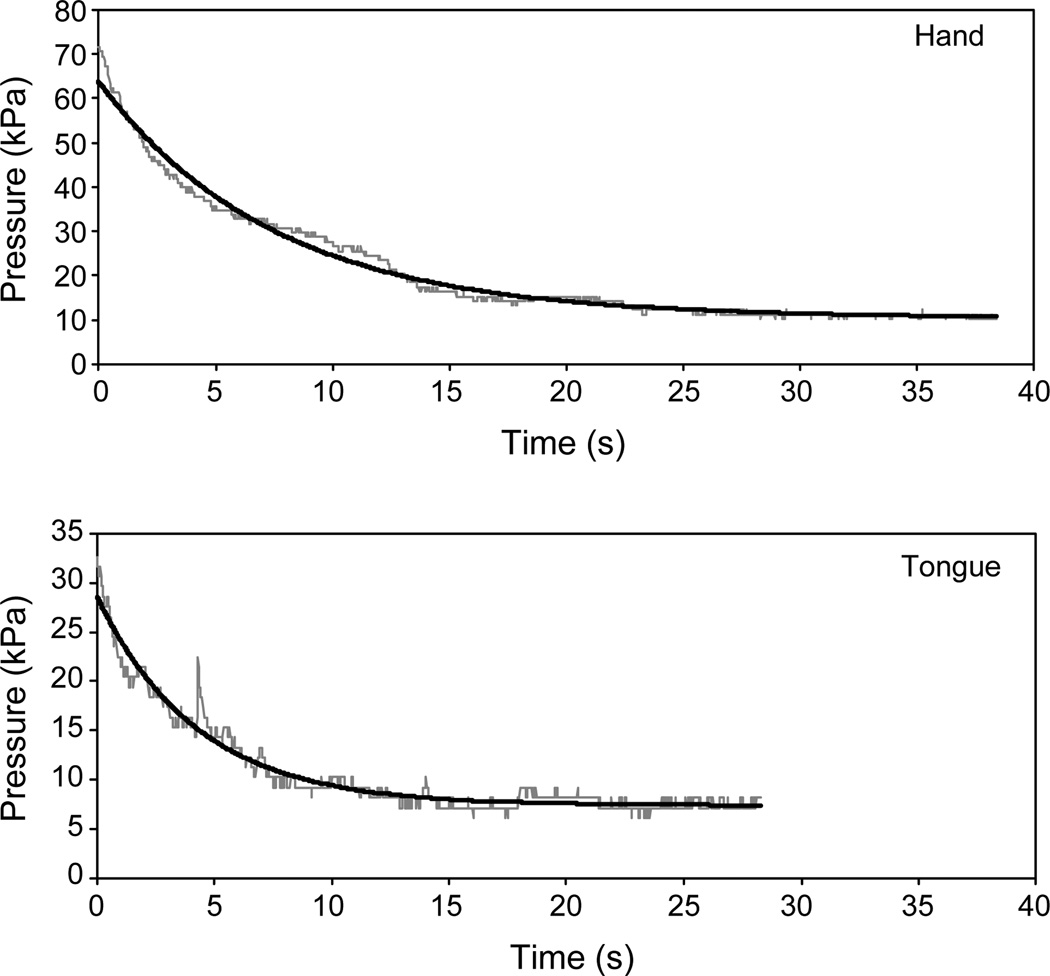
Fig. 2.
Constant-effort trials at 50% of maximum effort performed by the hand (A) and the tongue (B) by one subject with Parkinson’s disease. The raw pressure signal is plotted in gray, and the fitted exponential curve is black. The time constants (TC) for the exponential functions are 7.5 s (r2 = .98) for the hand, and 4.3 s (r2 = .96) for the tongue.

