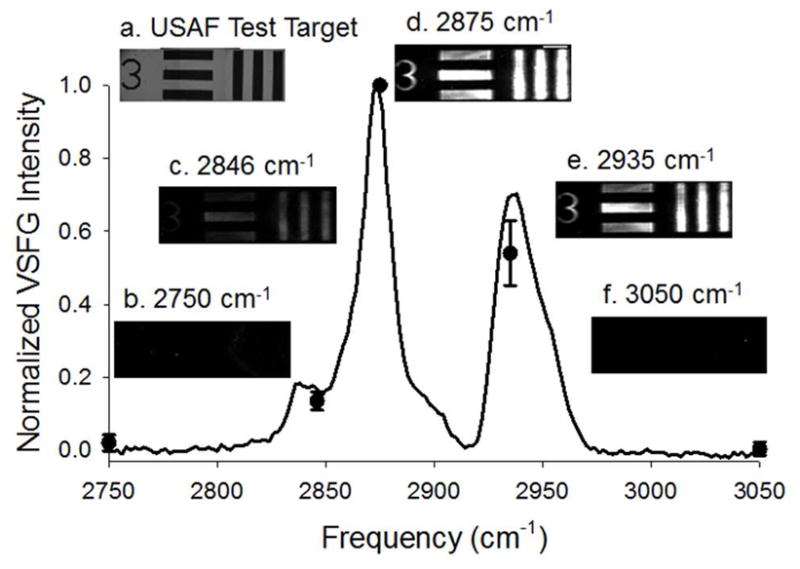
Figure 4.

SFVI images of a patterned DSPC/DSPC-d70 bilayer using (a) USAF test target group-element 0-3 (white light image using a standard laboratory microscope) corresponding to 397 μm line-width acquired at the reported frequencies (b–d). The six line-widths were first individually normalized to their identical initial line-width intensity at 2875 cm−1 and reproduced in three separate experiments. The averaged SFVS spectrum from three experiments is also shown for a patterned DSPC/DSPC-d70 bilayer (solid black line). The scale bar represents 1 mm.
