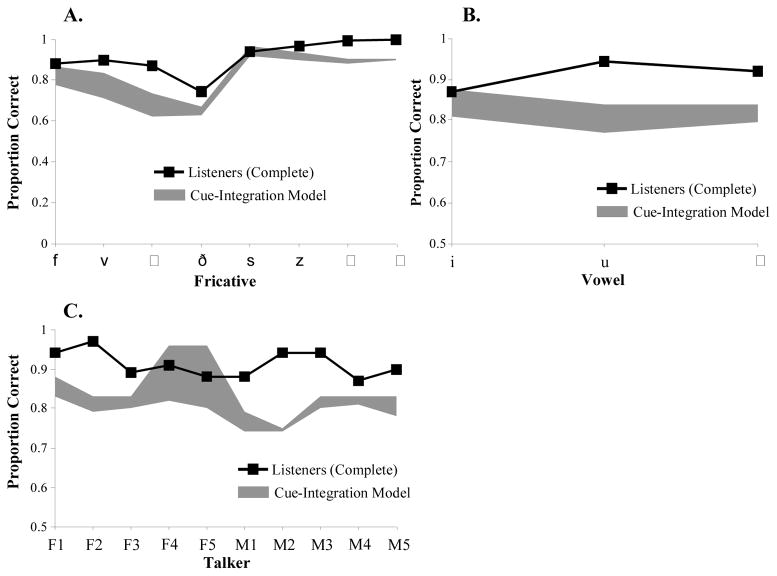
Figure 4.
Performance of the cue-integration model and human listeners on the complete syllable condition. Model performance is represented by the gray range whose lower bound is performance using the probabilistic rule and whose upper bound reflects the discrete-choice rule. A) The complete model as a function of fricative. B) The complete model as a function of vowel context. C) The complete model as a function of speaker.

