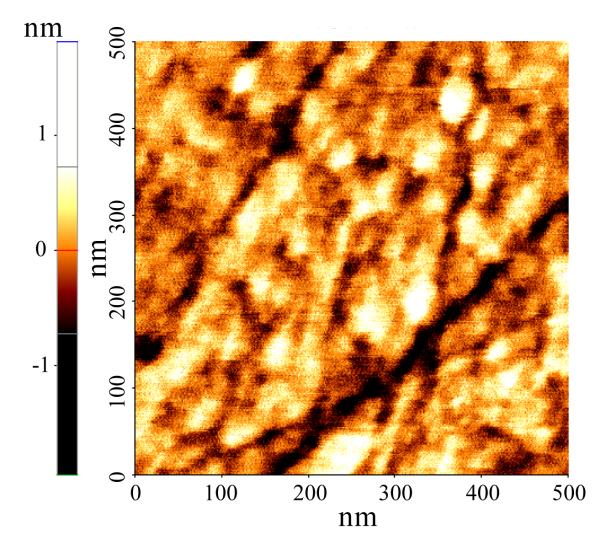
Figure 3.
Example AFM micrograph of monolayer #4 which has a surface density of 2.50×1014 cm−2. The color range used in the image shows variations in the range of about ±7 Å. The Rq for this image is 0.42 nm and the autocorrelation function decays on a ~10 nm length scale. Significant correlation in peak heights is visible on the 10 nm length scale in the image. No evidence of island formation is seen in this image or larger scale images.

