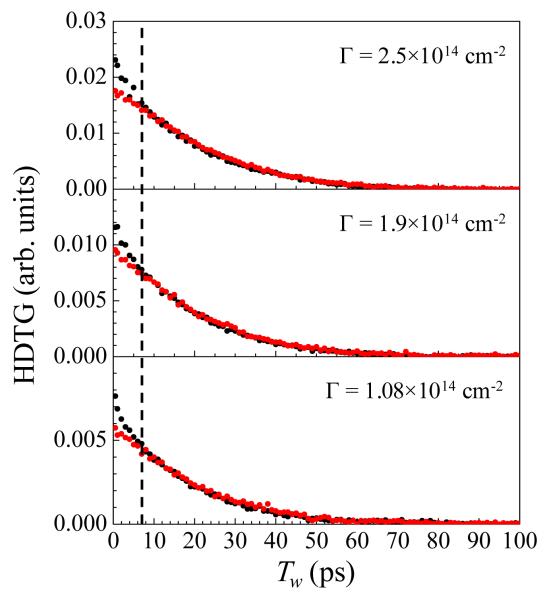
Figure 4.
Polarization resolved heterodyne detected transient grating data for three different surface densities. Black circles are parallel polarization, and red circles are perpendicular polarization. A least squares fit has been performed to set the amplitudes to comparable scales, as the experiments are done with different absolute sensitivities. The curves are seen to decay with exactly the same functional form after about 7 ps (dashed vertical line). The early time discrepancy is most likely due to wobbling motions of the RePhen(CO)3Cl head groups (see text for discussion). No change in the agreement between parallel and perpendicular decays is seen as a function of concentration.

