Figure 8.
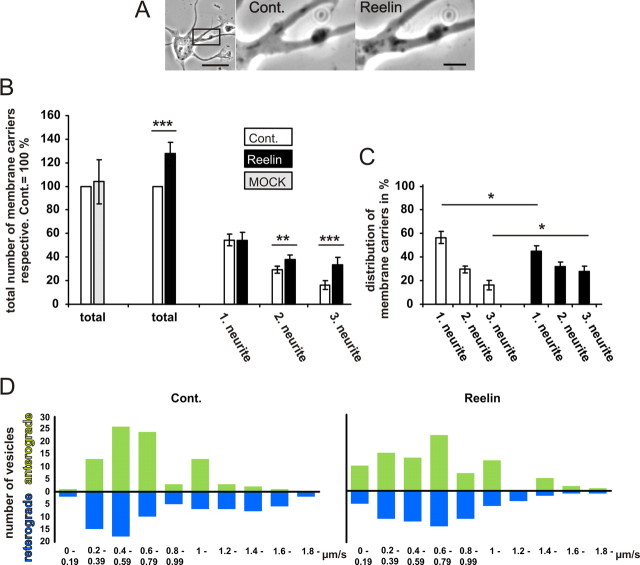
Reelin increases vesicle traffic. A, Traffic of vesicles and membrane compartments in all neurites was imaged by phase-contrast microscopy. Images were collected every second over a 3 min interval (see also supplemental Movie S6, available at www.jneurosci.org as supplemental material). Scale bars: left, 10 μm; right, 2 μm. B, The numbers of membrane carriers traveling within 3 min through a defined neurite segment were counted for all neurites. Numbers were sorted according to the number of membrane carriers counted during the control period. In control neurons, the first column represents the traffic in the axon, which is defined as the neurite with the most intense traffic. The total number per neuron of the control period was set as 100% and was compared with a 3 min interval of the same neuron 15 min after addition of Reelin (means ± SEM; n = 20; **p < 0.01; ***p < 0.001 vs controls). C, To compare the relative distribution of membrane carriers between axons (1.00 neurite) and dendrites (2.00 and 3.00 neurites), both the total number of vesicles of the Reelin period and the control period were set as 100% (means ± SEM; n = 20; *p < 0.05 vs controls). D, Frequency distribution of the velocities of the membrane carriers were measured. One hundred fifty or more membrane carriers were tracked for each condition, and the speed of anterograde or retrograde transport was measured. The overlapping peaks in the frequency distribution diagrams show that there is no significant change in the distribution of velocities measured in control neurons and Reelin-treated neurons. Cont., Control.

