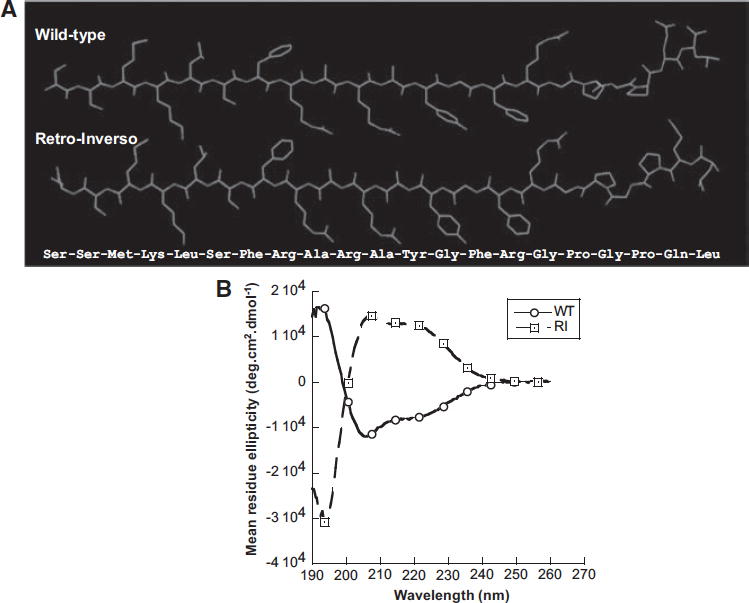
Figure 3. Structural biology.

(A) Molecular modeling of W-T and R-I peptides. The structures were created in ChemDraw and the inversion of chirality was achieved in Chem3D, followed by energy minimization (MM2 force field).
(B) Circular Dichroism (CD) spectroscopy of W-T vs. R-I synthetic catestatin regions from human CHGA. CD spectra of 21-amino acid catestatin peptides (hCgA352-372) at 0.125 mg/ml in 98% 2,2,2-trifluoroethanol were taken over 190–260 nm.
