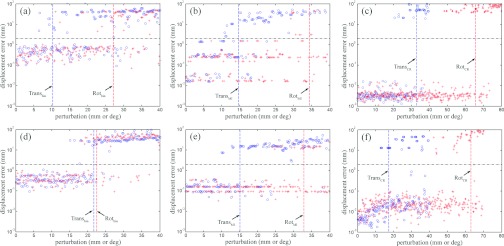
Figure 8.

Representative scatter plots of distance error vs translational (open circle) and rotational (cross) perturbations for binary (a) and (d), MI (b) and (e), and CR (c) and (f) registrations for two patients (patient 1: top; patient 8: bottom). Distance errors are shown on a log scale. Vertical dashed lines indicate capture ranges, while the horizontal lines indicate the distance error threshold used to define successful registrations.
