
Figure 3. T cell responses in DC-transferred MRL/lpr mice.
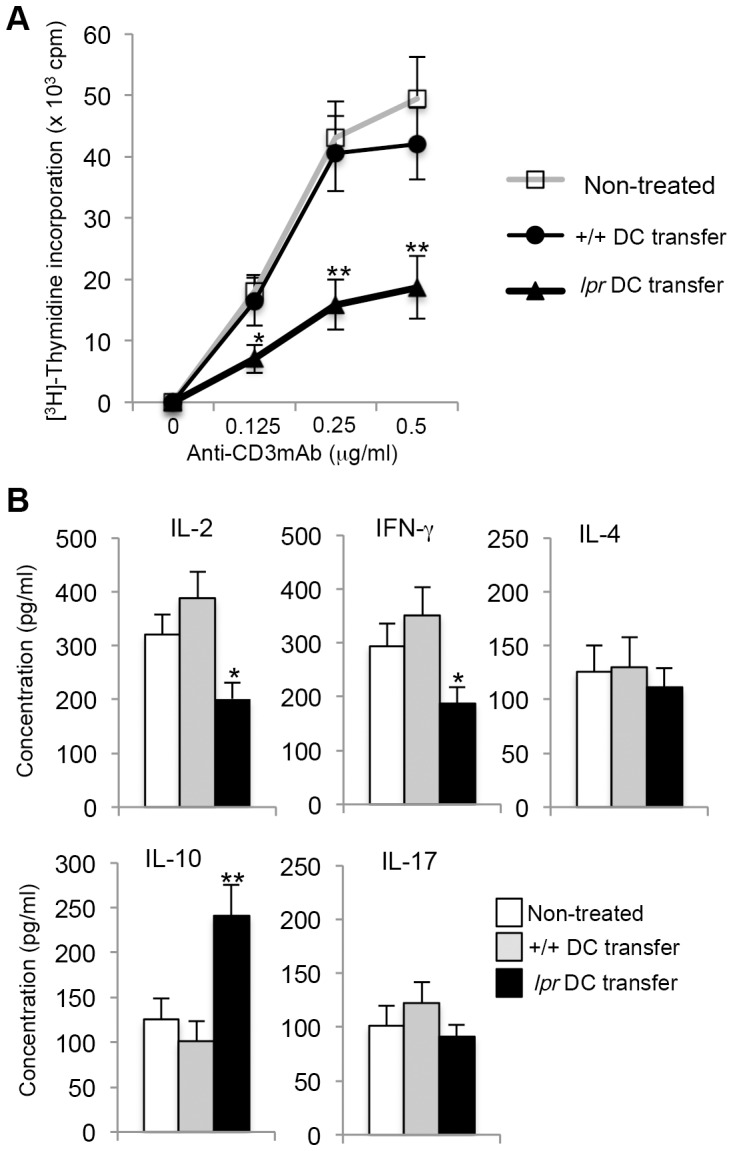
(A) Proliferative responses of ILN CD4+ T cells from the recipients and control mice were analyzed. Purified CD4+ T cells were stimulated with plate-coated CD3 mAb (0–0.5 µg/ml) and CD28 mAb (10 µg/ml) for 72 hours. The proliferative response was evaluated by [3H] thymidine incorporation. Values are means ± SD (n = 4, 5, and 5 respectively per group). Results are representative of three independent experiments with similar results. (B) The culture supernatants for 24 h (anti-CD3 mAb: 0.5 µg/ml; anti-CD28 mAb: 10 µg/ml) as described above were analyzed for cytokine productions including IL-2, IFN-γ, IL-4, IL-10, and IL-17 by ELISA. Values are means ± SD (n = 4, 5, and 5 respectively per group). *p<0.05, **p<0.005.