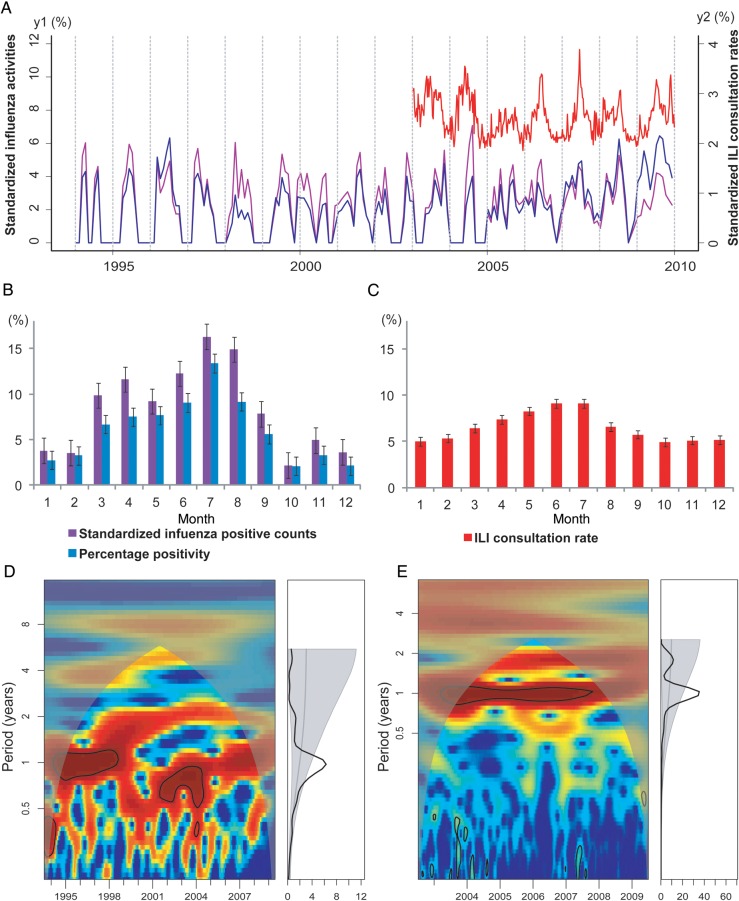
Figure 1.
Seasonality of influenza epidemics in Shenzhen, China, 1995–2009. A, Time series of the standardized number of influenza virus–positive specimens (calculated as the monthly number of influenza virus–positive specimens divided by the annual number of influenza virus–positive specimens; purple line, left y-axis), the “percentage positivity” (calculated as the monthly number of influenza virus–positive specimens divided by the monthly number of all specimens tested; blue line, left y-axis), and influenza-like illness (ILI) consultation rates (calculated as the weekly number of consultations for ILI divided by the weekly number of all consultations; red line, right y-axis). All time series have been square-root transformed. B, Monthly standardized number of influenza virus–positive specimens (purple) and percentage positivity (blue) during 1995–2008 (the 2009 pandemic influenza A virus subtype H1N1 season was omitted). Color bars represent the average proportion of influenza virus–positive patients identified in each month of the year. Error bars show standard errors based on variation between years. C, Same as B, but for monthly ILI consultation rate (in red) during 2003–2008. D, Wavelet power spectrum of standardized influenza positive counts during 1995–2009, identifying changes in periodicities over time (left) and average periodicity (right). Power increases from blue to red so that red indicates stronger periodicities. Black lines highlight periodicities reaching statistical significance (here, 1-year periodicities). Shaded areas indicate the presence of edge effects. E, Same as panel D, but for ILI consultation rate, 2003–2009.

