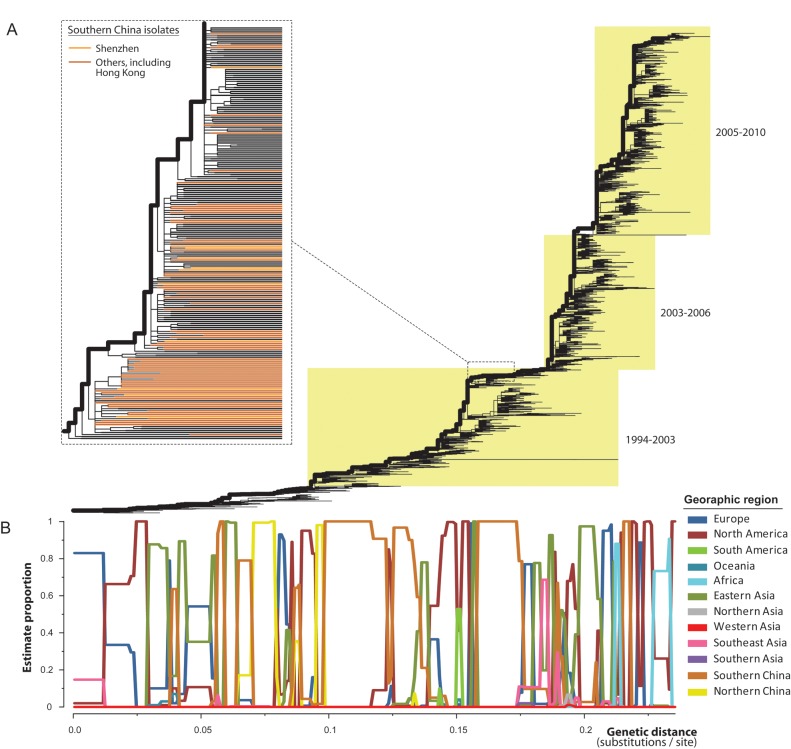
Figure 3.
Phylogeographic analysis of influenza A virus subtype H3N2. A, Maximum likelihood phylogeny of global isolates of the virus, with the trunk lineages shown by bold lines. Dashed lines indicate a magnification of that part of the tree where isolates from Shenzhen and other areas in southern China fall and indicated by light and dark orange colors, respectively (branches extended to the same level). B, Estimated proportions of geographic regions in the trunk lineages were plotted against their genetic distance from the tree root (units of nucleotide substitutions per site).

