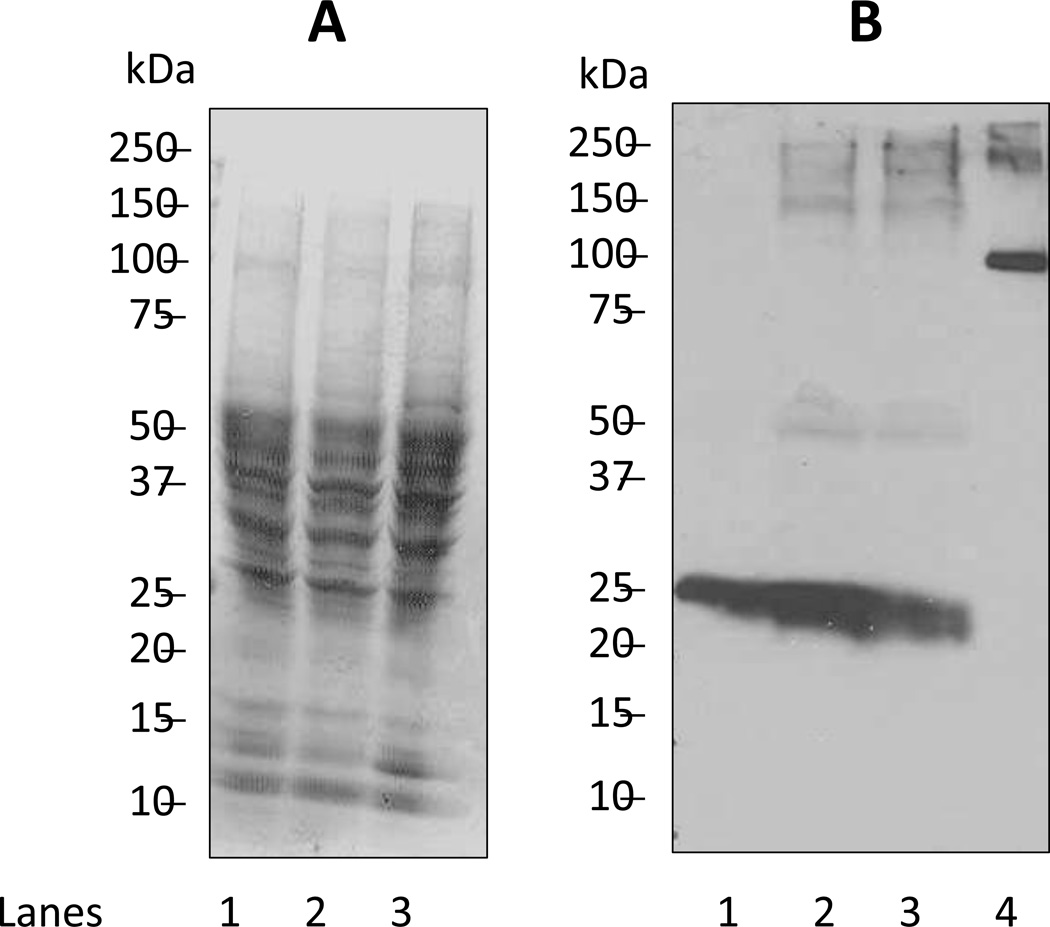
Figure 4.
Biochemical analysis of protein nitration in cerebellar slices pre-exposed to SIN-1. Migration of molecular size standards are shown on the left of each electropherogram/Western blot. A) Separation of proteins by SDS-PAGE and visualization by Coomassie Blue staining. To each lane of the gel we added 100 µg protein extracted from cerebellar slices that were either not incubated or incubated with SIN-1 as indicated: Lane 1, no exposure to SIN-1; Lane 2, incubated with 3 mM SIN-1; Lane 3, incubated with 10 mM SIN-1. B) Immunoblot detection of nitrated proteins using anti-3-NT monoclonal antibody as described under Methods. Lanes 1–3 as in Figure 4A; lane 4 represents 0.1 µg of nitrated rabbit myophosphorylase b standard (5 pmol of 3-NT).

