
Figure 2.
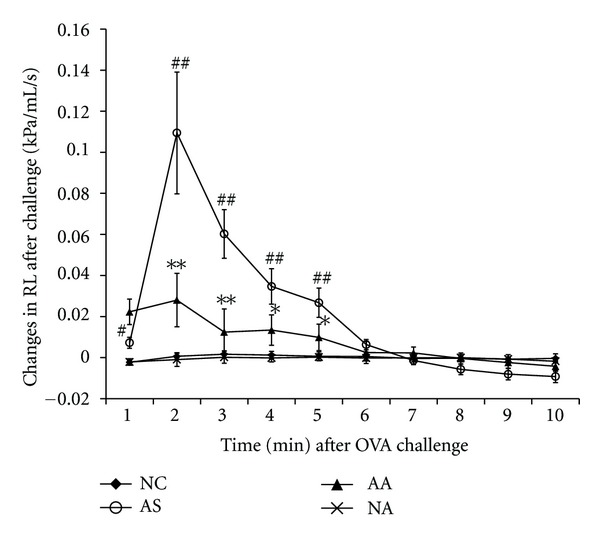
Changes in the pulmonary resistance (RL) within 10 min after challenge in NC (n = 15, sensitized and challenged with saline), AS (n = 14, sensitized and challenged with OVA), AA (n = 12, sensitized and challenged with OVA + acupuncture treatment) and NA (n = 15, sensitized and challenged with saline + acupuncture treatment).The changes in the RL are expressed as differential values subtracted from the corresponding baseline values (Figure 1). Each point represents the mean ± SEM. # P < 0.05, ## P < 0.01 when comparing the AS group with the NC group and *P < 0.05, **P < 0.01 when comparing the AA group with the AS group.