Fig. 2.
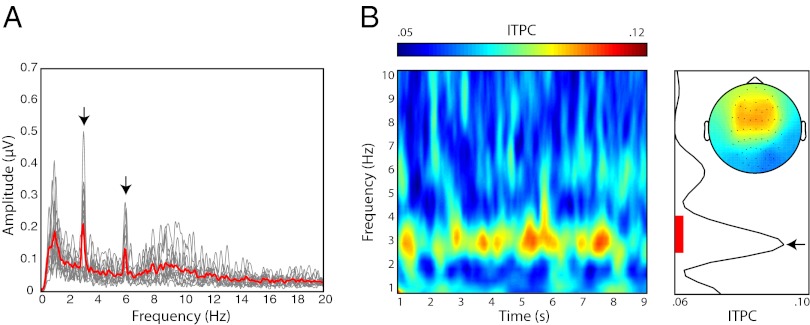
(A) Amplitude spectrum from fast Fourier transform (FFT) of time-domain EEG signal. Amplitude in the 3-Hz and 6-Hz frequency bins was significantly larger than in the neighboring bins. Red solid line indicates the group average spectrum, gray lines show single participants’ spectra, averaged over all electrodes. (B) ITPC shown over time (Left), and averaged over time (Right), again averaged over all electrodes. The red bar indicates the frequency region in which phase coherence was significantly greater than baseline. Inset shows the topography for the significant frequency region, averaged over time; the color scale is the same as for the time-frequency representation of ITPC.

