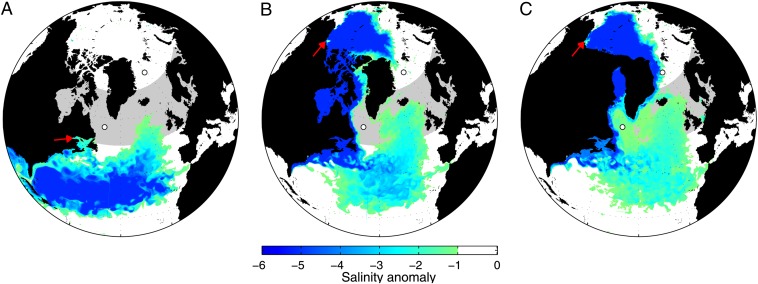
Fig. 2.
The dispersal of meltwater in the North Atlantic. The colors (green-blue) show the difference in surface salinity (perturbation minus control) in response to releasing meltwater from the (A) Gulf of St. Lawrence and (B and C) Mackenzie Valley with the CAA (B) open and (C) closed. The snapshots are drawn 32, 43, and 56 mo, respectively, after the meltwater release and coincide with the time of maximum surface freshening. Red arrows are the discharge locations. White circles are locations where open-ocean deep convection has been observed (30) in the modern-day ocean: Ocean Weather Station Bravo (56.5° N, 51° W) and Greenland Sea (75° N, 3° W). The gray shading (50° N to 70° N) is the traditional climate model meltwater hosing region.

