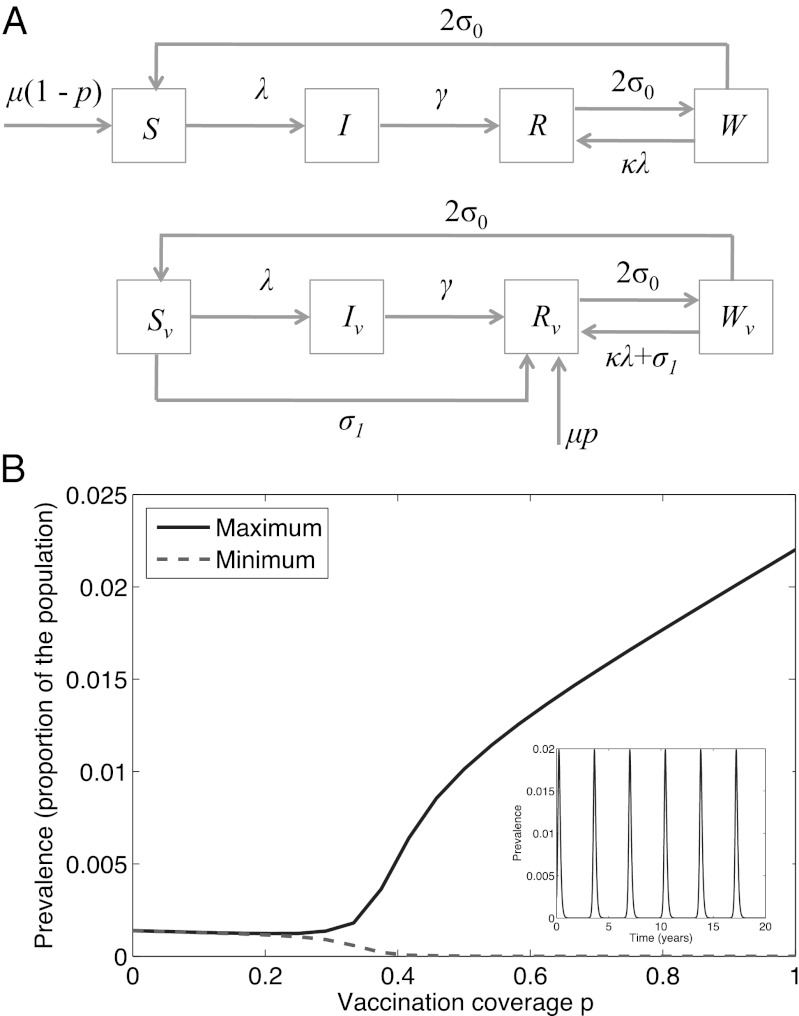
Fig. 3.
A model for natural boosting. (A) Schematic illustration of a simple extension of the model presented in ref. 9, to incorporate self-boosting vaccines (Lower). (B) Diagram illustrating the phase transition occurring in this model (9), when σ1 = 0 and with increasing coverage of conventional vaccination. Parameters are as in Fig. 1B and as in ref. 9. Inset shows the time course of prevalence at 95% coverage (P = 0.95), illustrating epidemic cycles in this regime.

