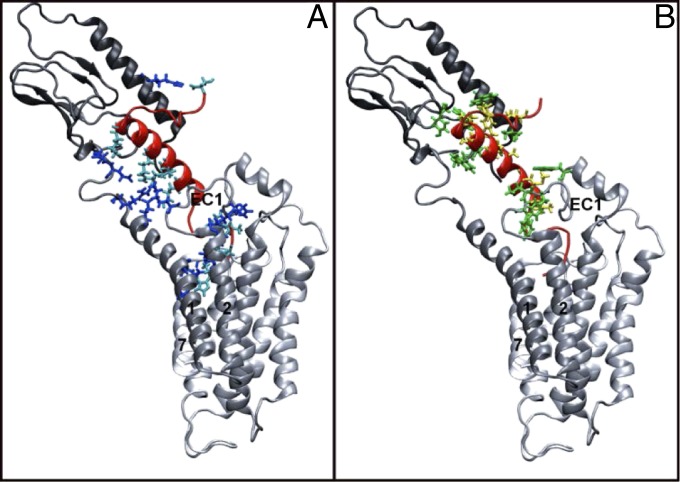
Fig. 3.
Overview of the ligand binding site’s hydrophobic (A) and hydrophilic (B) interactions. GLP1R is shown with a color transition from black to white as the protein goes from the N terminus to the C terminus. Exe4 is shown in red. Hydrophilic interactions are shown in A, with protein residues in blue and ligand residues in turquoise. Hydrophobic interactions are shown in B, with protein residues in green, and ligand residues in yellow.

