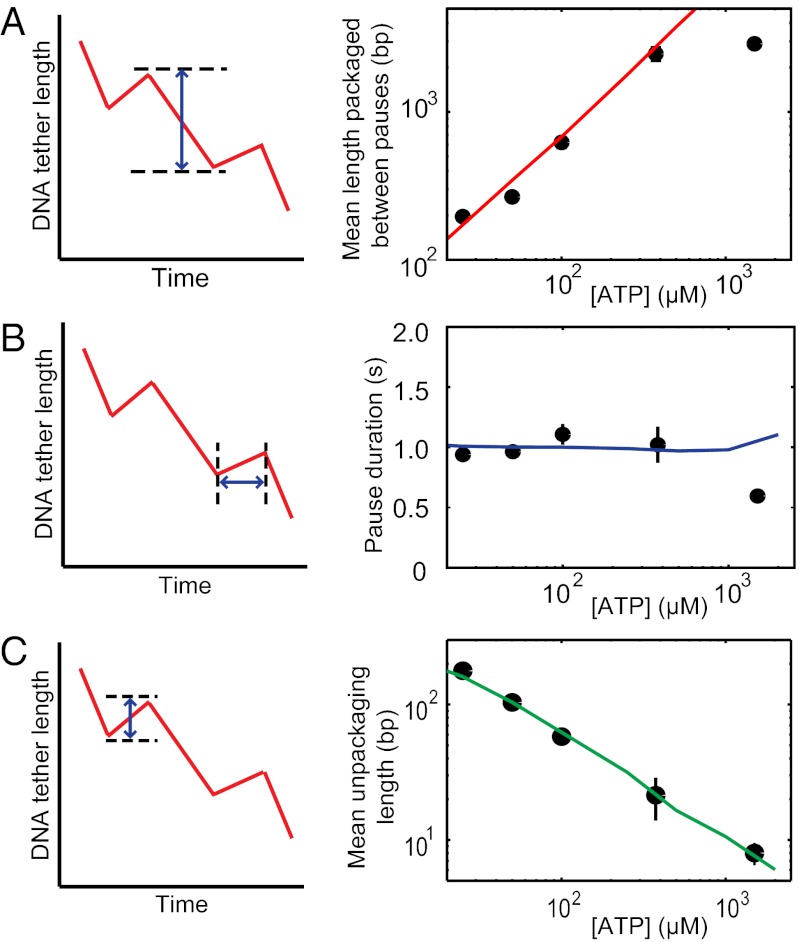
Fig. 2.
Pause characteristics over different ATP concentrations. (A) The mean length packaged between pauses (Left) decreases as ATP concentration is reduced (black circles; Right). (B) The average pause duration (Left) across ATP concentrations remains approximately the same (black circles; Right). (C) The unpackaged DNA length (Left) increases with decreasing ATP concentration (black circles; Right). Error bars represent SD. Kinetic simulations (red, blue, and green lines in A, B, and C, respectively) reproduce the observed experimental data.

