Figure 6.
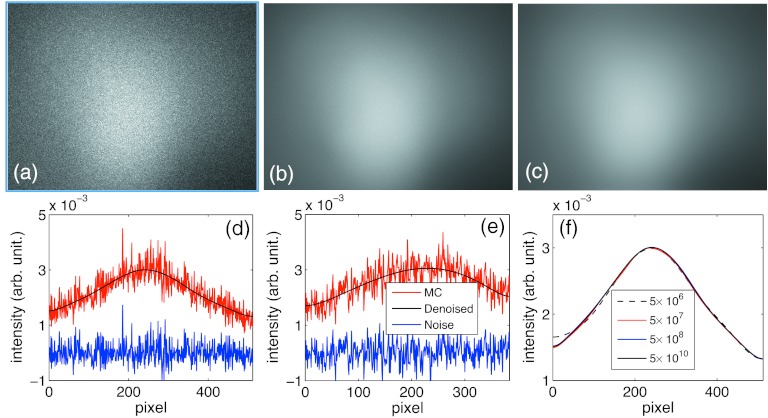
(a) and (b) are scatter signals of a HN patient simulated using gDRR with 5 × 10⁸ and 5 × 10¹⁰ source photons. (c) shows the denoised scatter image from simulations in (a). (d) and (e) show the signal profiles along the u and the v axes, respectively. (f) is the comparisons of the denoised scatter image profiles along the u axis with various number of photons.

