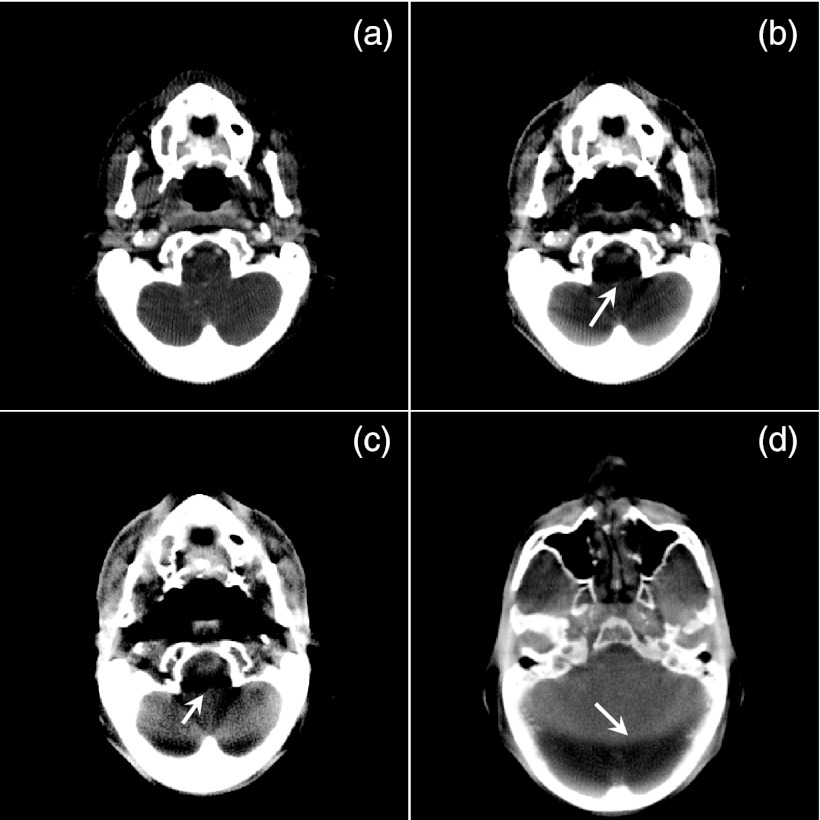
Figure 9.
CBCT images reconstructed from the simulated projections. (a) From only primary signal with a monoenergetic source. (b) From primary signal with a polyenergetic source. (c) and (d) From all three components. The display window is [−100, 340] HU for (a), [20, 460] HU for (b) and (c), and [−400, 890] HU for (a). Arrows indicate various CBCT artifacts.

