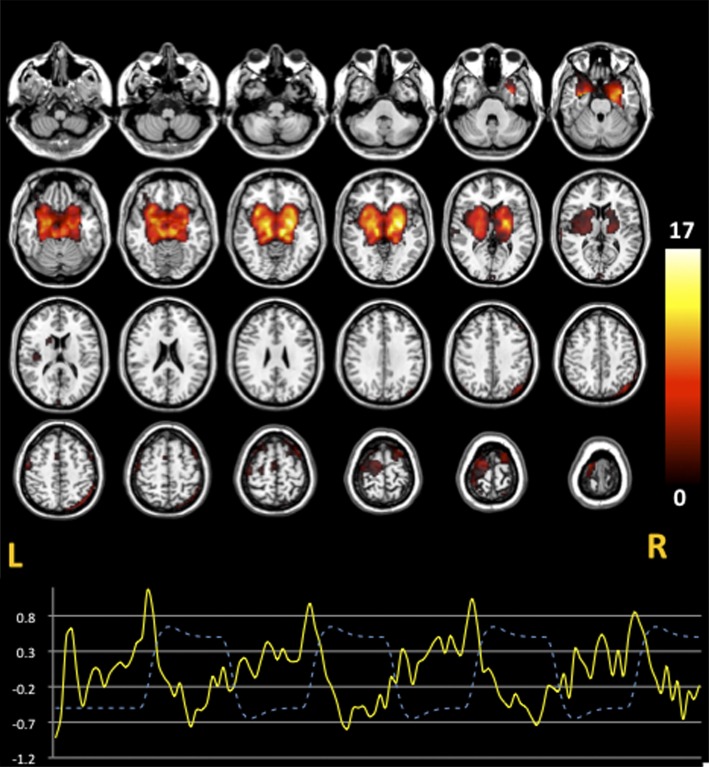
Fig. 2.
The striatal network. A striatal component including caudate, putamen, pallidus, left dorsolateral PFC, and right superior posterior parietal cortex was estimated. One sample t test images display the spatial pattern of the ICs identified (P < .005 uncorrected). TC represents the temporal profile of the striatal network component (continuous line) overlaid on the paradigm of working memory design (dashed line). Color bar indicates T-scores.

