Figure 1.
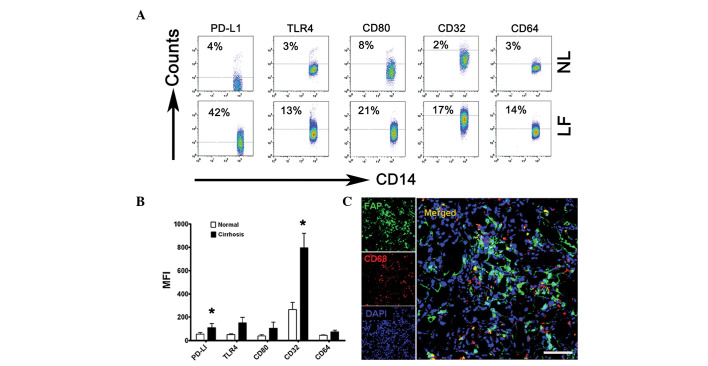
Kupffer cells were activated in the cirrhotic livers and were in contact with LMFs. (A and B) Flow cytometry analysis of PD-L1, TLR4, CD80, CD32 and CD64 expression on freshly isolated monocytes from NL (from 3 patients with hepatic hemangioma) and LF (from 12 patients with liver failure). (A) The percentage of expression of PD-L1, TLR4, CD80, CD32 and CD64 on CD14+ monocytes and (B) the MFI of these molecules are shown. The data in (A) are representative dot plots of ≥7 individuals from >5 independent experiments; (B) shows the statistical analysis of these samples. The results are expressed as the mean ± SEM. Significant differences in comparison with normal livers are indicated (*P<0.05). (C) Analysis of LMF (FAP+) and Kupffer cell (CD68+) distribution in cirrhotic liver samples by confocal microscopy. The micrographs show the contact of the LMFs and Kupffer cells; 1 out of 10 representative micrographs is shown. Bar, 200 μm. LMF, liver myofirbroblast; NL, normal livers; LF cirrhotic livers; MFI, mean fluorescence intensity; FAP, fibroblast activating protein.

