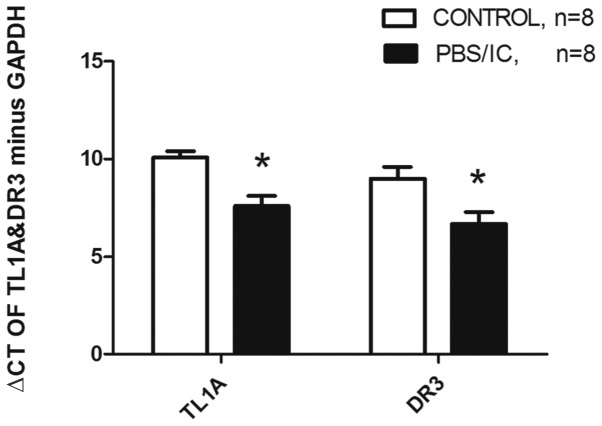
Figure 2.
TL1A and DR3 mRNA expression differences between IC patients and controls using the 2−ΔΔCt method. Quantitative analysis shows the ΔCt of TL1A and DR3 minus GAPDH to be lower in the IC patients than in the controls, indicating that mRNA levels of the IC patients are higher than those of the controls. PBS/IC, painful bladder syndrome/interstitial cystitis; TL1A, TNF ligand-related molecule 1A; TNF, tumor necrosis factor; DR3, death receptor 3. *P<0.05 vs. the control group.

