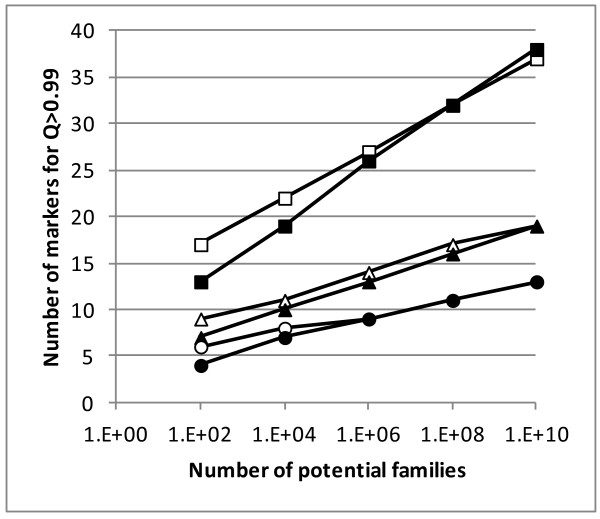
Figure 2.
Number of markers to achieve exclusion power greater than 0.99 for both terms in formula (7). Number of markers to achieve exclusion power greater than 0.99 for both terms in formula (7); white symbols for the Q1 term; black symbols for the Q3 term; squares = loci with three equally frequent alleles; triangles = loci with five equally frequent alleles; circles = loci with eight equally frequent alleles; the situations simulated included N potential fathers and N potential mothers and, thus, N2 families.

