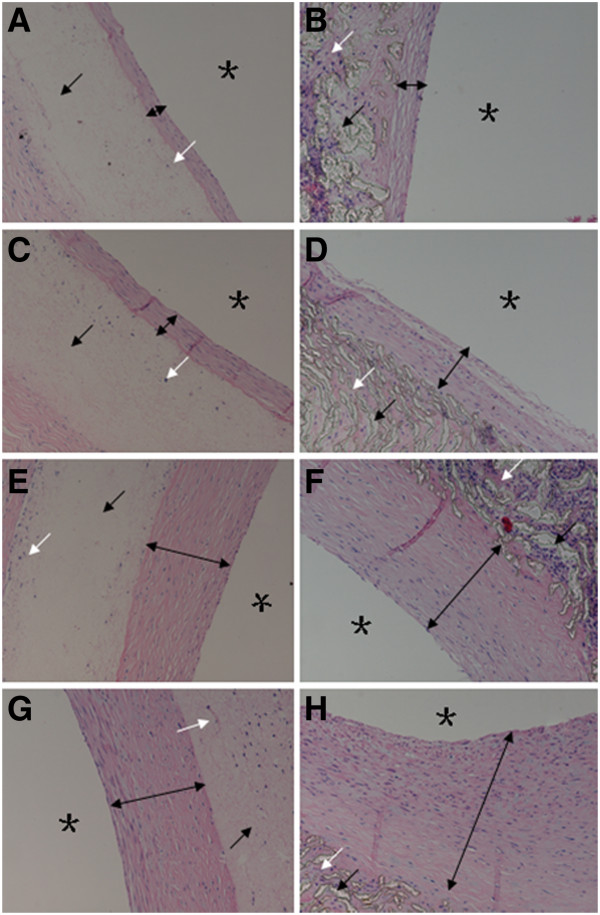
Figure 12.

Neointimal thicknesses at different time points(× 200). Black arrows indicate vascular grafts, white arrows ingrown tissue, black double arrows neointimal thicknesses, and black stars the graft lumens. (A), (C), (E), and (G): A PU graft showing insignificant neointimal hyperplasia. (B), (D), (F), and (H): A PTFE graft showing obvious neointimal hyperplasia.
