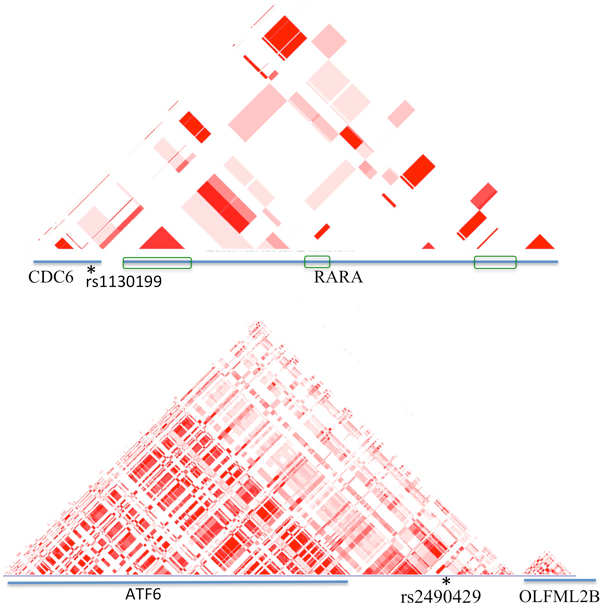
Figure 2.
LD blocks of two regions. LD is calculated based on r2 in the region of CDC6 and RARA, and ATF6 and OLFML2B using UCSC genome browser's HapMap LD Phased Track. The diagonal pattern illustrates the LD relationship between two regions. Blue lines represent genes. * indicates the location of the SNP. The green boxes in the upper panel represent the regions of RARA that have high association with CDC6, indicating the two genes are related. In the lower panel, although rs2490429 locates between ATF6 and OLFML2B, its neighborhood has strong association with ATF6.

