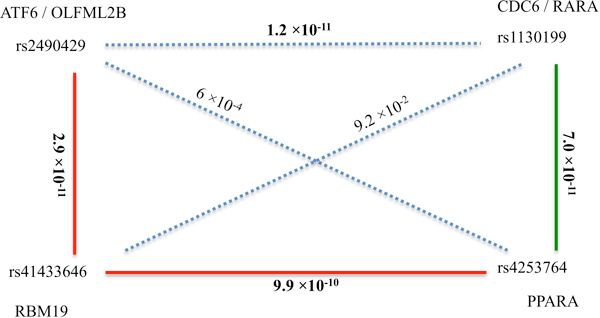
Figure 4.
Network constructed by interactions of SNPs detected by pathway and network analysis. Solid lines represent interactions detected by pathway or network analysis. The red lines represent interactions detected by network analysis, while the green line represents interaction detected by pathway analysis. The pathway and network analysis led to the detection of three interactions among four SNPs. Some SNPs pairs (such as rs2490429 and rs1130199), are never present in same pathway or network, thus the associations between them are not tested in either pathway or network analysis. Additional testing of these SNP pairs was conducted. The p-values for the dotted line come from these additional analyses. The significant p-values are in bold. The genes related to SNPs are positioned close to SNPs.

