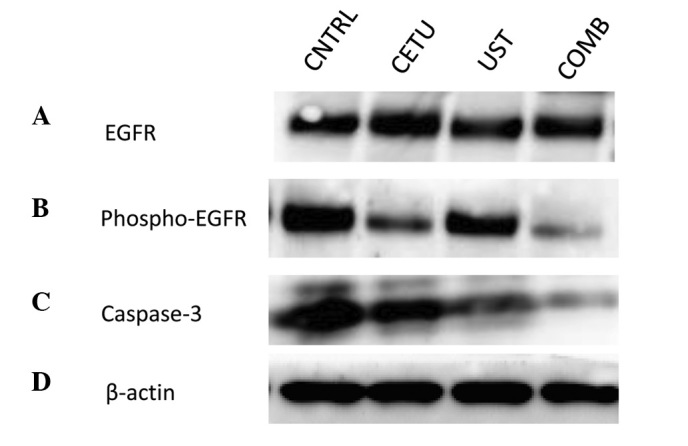
Figure 5.

The expression of EGFR, phospho-EGFR, and activation of caspase-3 signaling on HSC-3 cells after the treatment with western blot analysis. (A), EGFR; (B), phosphor-EGFR; (C), caspase-3; (D), β-actin. There were no differences of the expression of EGFR among the CETU, UST and COMB groups, while the expression of phospho-EGFR was down-regulated and moreover the cleavage of caspase-3 was upregulated in the COMB group compared with the other groups. CNTRL, non-treated; CETU, cetuximab-treated; UST, US-treated; COMB, combination of cetuximab and US-treated
