Figure 2.

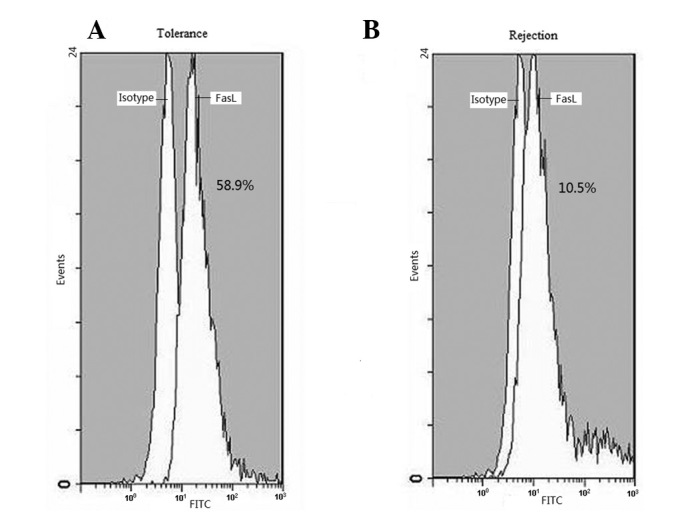
Flow cytometry analysis showing FasL expression in HSCs. FasL expression in HSCs from (A) the tolerance group was higher than in (B) the rejection group. HSCs, hepatic stellate cells.

Flow cytometry analysis showing FasL expression in HSCs. FasL expression in HSCs from (A) the tolerance group was higher than in (B) the rejection group. HSCs, hepatic stellate cells.