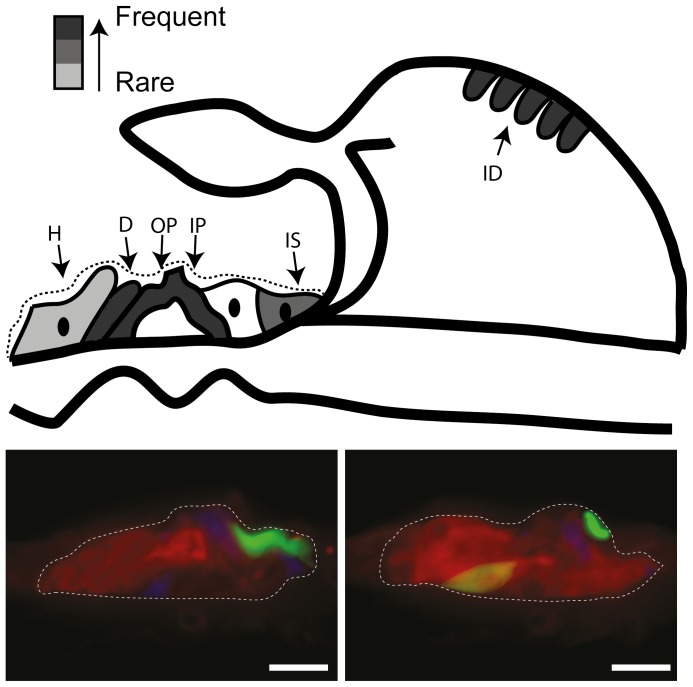
Figure 2. Schematic and photomicrographs of GFP expression in the deafened GP cochlea.
Injection of Ad-GFP or Ad-GFP-NTs into the SM when examined after at T12-wk (n = 9) resulted in GFP expression in the OC and interdental cells of the spiral limbus of the lower basal and upper basal turns (represented by greyscale coded schematic, with dark grey representing areas where GFP expression was frequently observed (n>5) and light grey representing areas where GFP expression was only rarely observed (n<2). Photomicrographs illustrate GFP expression (green), in the OC, specifically the inner and outer pillar cells (IP, OP), along with Deiters’ (D), Hensen’s (H) cells, inner sulcus cells (IS) and the interdental cells (ID) of the spiral limbus. Sections are co-labelled with anti-calretinin (red) and phalloidin (blue). Scale bars = 20 µm.

