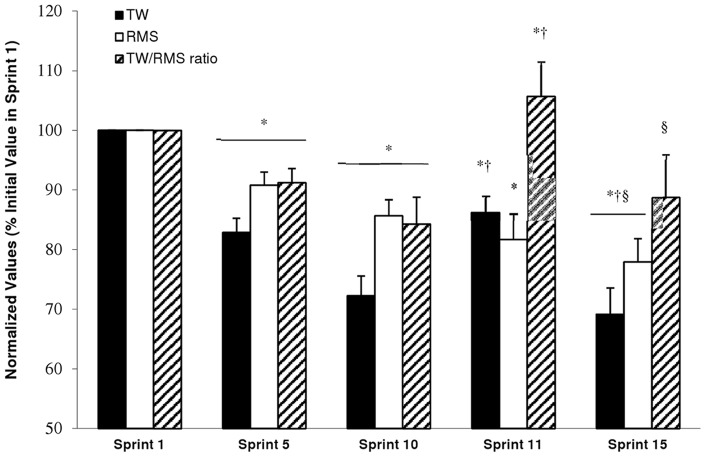
Figure 4. Evolution of the total work done (TW, black column), EMG root mean square of the vastus lateralis muscle (RMS, white column), and TW/RMS ratio (cross-hatch column) for the entire group over selected sprints.
Data are presented as means ± SEM, expressed as a % of sprint 1 (n = 8). * Significantly different from Sprint 1, P<0.05; † Significantly different from Sprint 10, P<0.05; § Significantly different from Sprint 10, P<0.05.

