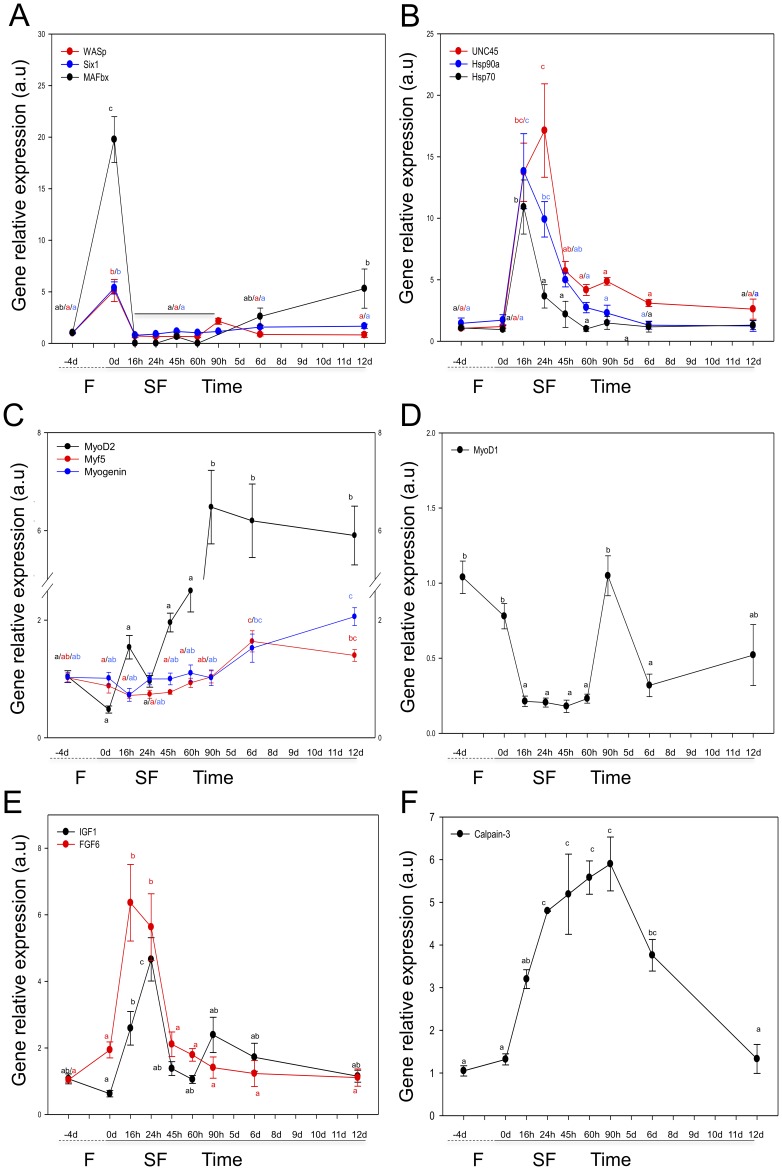
Figure 3. Relative expression of genes consistently affected by nutritional state.
Effect of varying nutritional input on gene expression in skeletal muscle during 4 days of fasting (F, dashed line) and 12 days of satiation feeding (SF, solid line). Values represent mean ± SE (N = 8). Different black, red and blue letters indicate significant differences between mean values (P<0.05). A) MAFbx (black), Six1 (blue) and WASp (red), genes up-regulated with fasting B) Molecular chaperones, Hsp70 (black), UNC45 (red) and Hsp90α (blue), C) Myogenic Regulatory Factors, MyoD2 (black), Myf5 (red) and Myogenin (blue), D) MyoD1, E) Growth Factors, IGF1 (black) and FGF6 (red), F) Ca2+-activated protease, Calpain-3.

