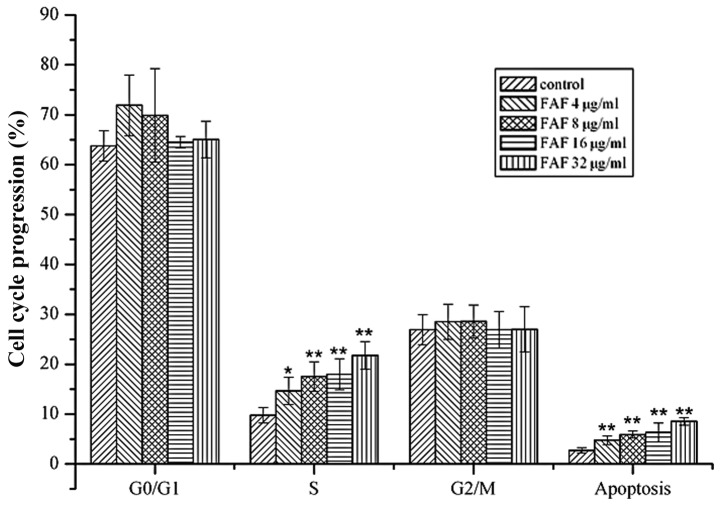
Figure 2.
Cell apoptosis and cell cycle progression of the SGC-7901 cell line treated with FAFs. SGC-7901 cells were treated with various concentrations of FAFs (4, 8, 16 and 32 μg/ml) for 72 h. Cell cycle phase distribution of the treated cells was measured by flow cytometry. Each group was analyzed in triplicate. *p<0.05 and **p<0.01 compared with the control group. FAFs, Flos Albiziae flavonoids.

