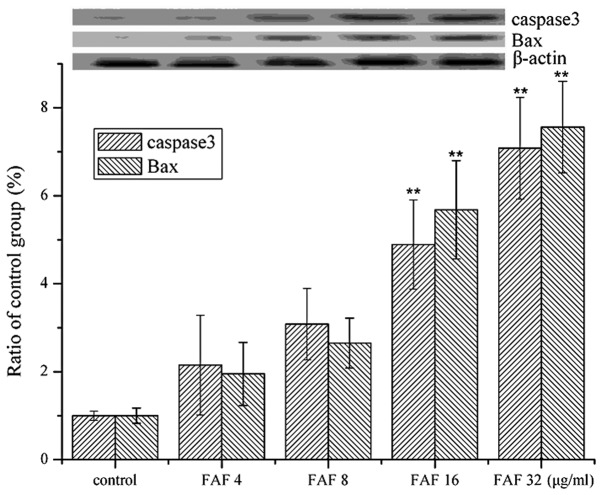
Figure 6.
Western blot analysis for the expression of caspase 3 and Bax. Cells were treated with various concentrations of FAFs (4–32 μg/ml) for 48 h. Relative protein expression was quantified densitometrically using the Image-Pro Plus Version 6.0 software and calculated according to the β-actin reference bands. Reported values are the means ± SD (n=3). **p<0.01 compared with the control group. FAFs, Flos Albiziae flavonoids.

