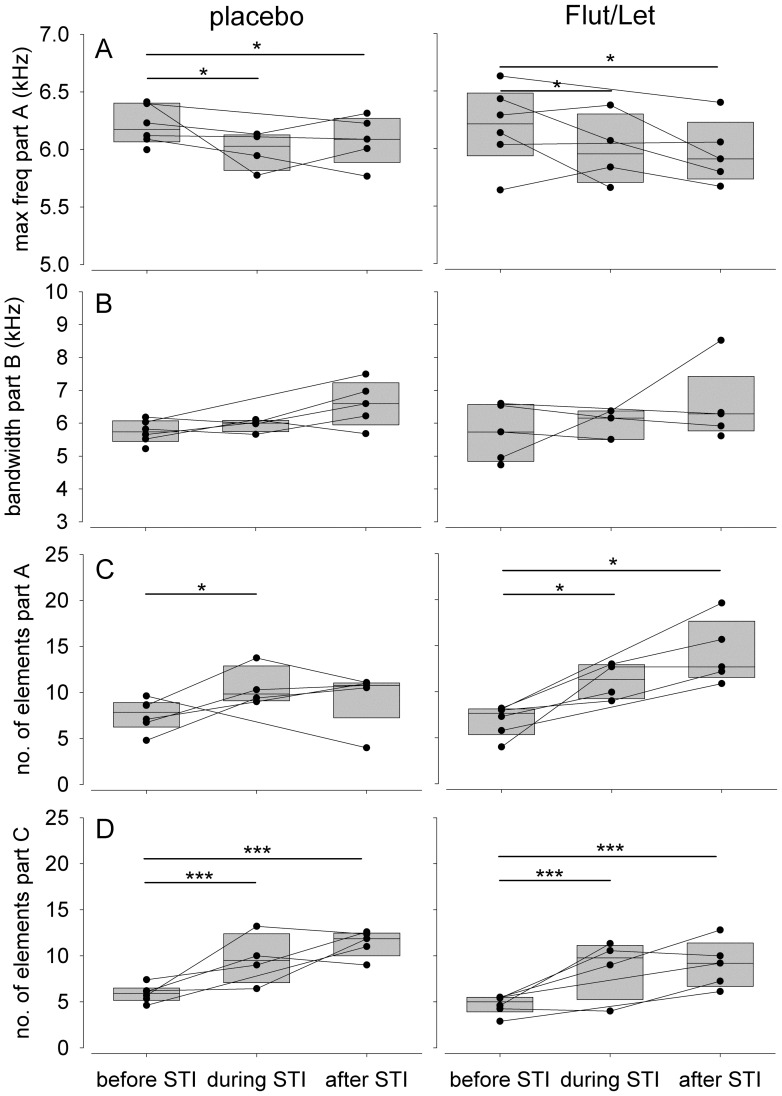
Figure 4. Structural song measures before, during and after the STI.
Depicted separately for males treated with flutamide and letrozole (‘Flut/Let’, n = 6) and placebo treated males (‘placebo’, n = 6) in fall. Each circle represents one individual male and measurements of the same male are connected by a line. Asterisks indicate significance (* p<0.05, *** p<0.001) and are according to a priori set contrasts (before vs. STI and before vs. after the STI).

