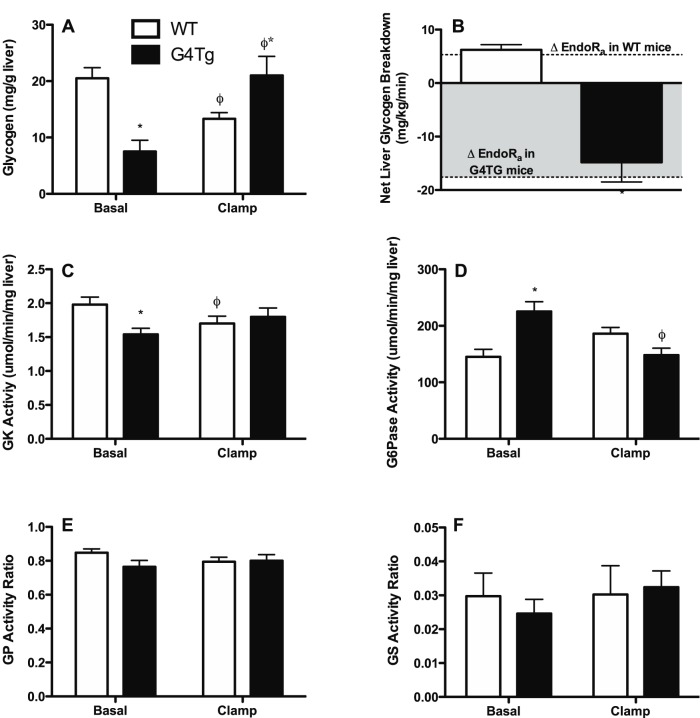
Figure 2. Hepatic glycogen and related enzyme activities in response to acutely normalizing blood glucose in glucose transporter 4 over-expressing mice (G4Tg) and wild-type (WT) littermates.
Hepatic glycogen content (A), hepatic glycogen breakdown (B), and activities or activity ratios of glucokinase (GK; C), glucose-6-phosphatase (G6Pase; D), glycogen phosphorylase (GP; E), and glycogen synthase (GS; F)] are shown before and after normalizing blood glucose in 5 h-fasted mice that over-express glucose transporter 4 (Glut4) in skeletal muscle, heart, and adipose tissue and wild-type (WT) littermates using a 90 min phloridzin (80 μg·kg−1·min−1)-glucose (115 mg·dL−1) clamp. Separate cohorts of mice were used to obtain basal and clamp data. Dashed lines in panel B denote changes in endogenous appearance of glucose (endoRa; shown in Figure 1C). Data are presented as means ± SEM and * and ϕ indicate p<0.05 compared to WT littermates or to basal values within a genotype, respectively. n = 7–8 mice in each group.

