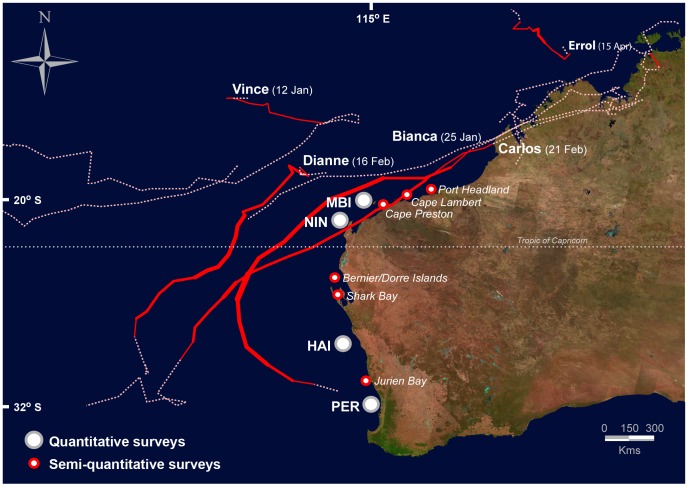
Figure 2. Map of cyclone tracks and survey locations.
Map of cyclone tracks for the period November 2010– May 2011. Cyclone tracks shown as solid lines with thickness of the tracks proportional to strength category (maximum strength category 4); dashed-lines indicate tropical low before or after cyclone designation. Locations of quantitative and semi-quantitative survey sites shown as filled circles (see legend in graph).

