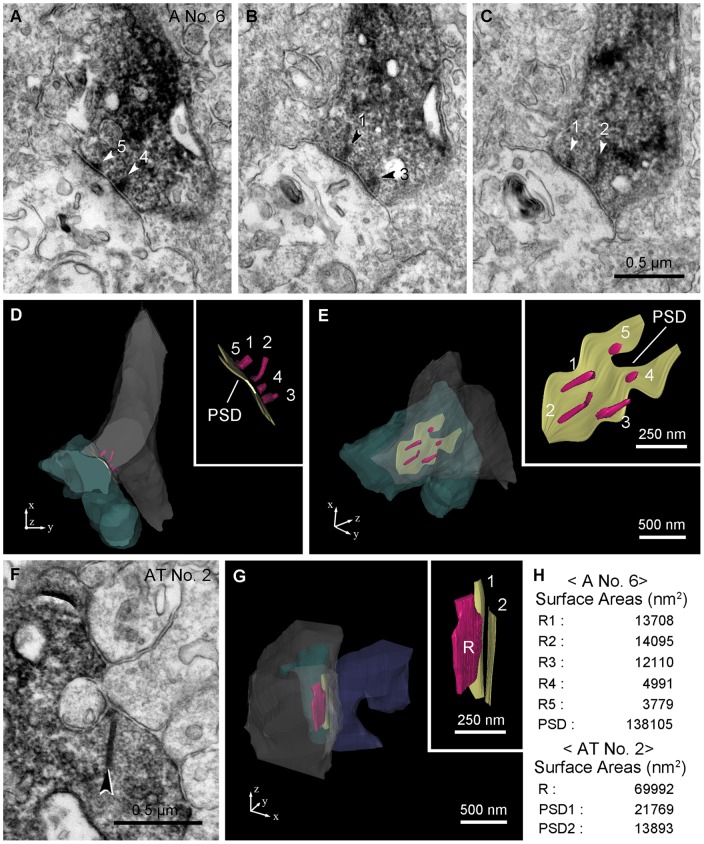
Figure 4. 3D reconstruction of axonal and axon terminal synapses of a calbindin ON cone bipolar cell.
A–E: The 3D reconstruction of No. 6 axonal (A) synapse was derived from electron micrographs. A–C: Three electron micrographs of a calbindin ON cone bipolar axonal synapse show five synaptic ribbons (1–5, arrowheads) and a broad postsynaptic density on a postsynaptic amacrine process. D, E: Reconstructed synaptic ribbons (R, maroon) of a calbindin bipolar axon (gray) and the postsynaptic density (PSD, khaki) of an amacrine process (sea green) are displayed at two different angles and insets show magnified synaptic ribbons and the postsynaptic density. F, G: 3D reconstruction of No. 2 axon terminal (AT) synapse was derived from electron micrographs. F: An electron micrograph shows a calbindin ON cone bipolar axon terminal synapse containing a synaptic ribbon (arrowhead) and its postsynaptic dyad. G: A synaptic ribbon (R) of a calbinidn bipolar axon terminal (gray) and two postsynaptic densities (1, 2) of the postsynaptic elements composed of an amacrine (state blue) and a ganglion (sea green) are seen. H: Data from image analysis of surface area of the synaptic ribbon and the postsynaptic density from No. 6 axonal synapse (D, E) and No. 2 axon terminal synapse. The table shows that individual axonal ribbons are smaller but the post-synaptic density at axonal ribbons is much larger compared to the axon terminal synapses.

