
Figure 2. Hepatic lipid accumulation and triglyceride content.
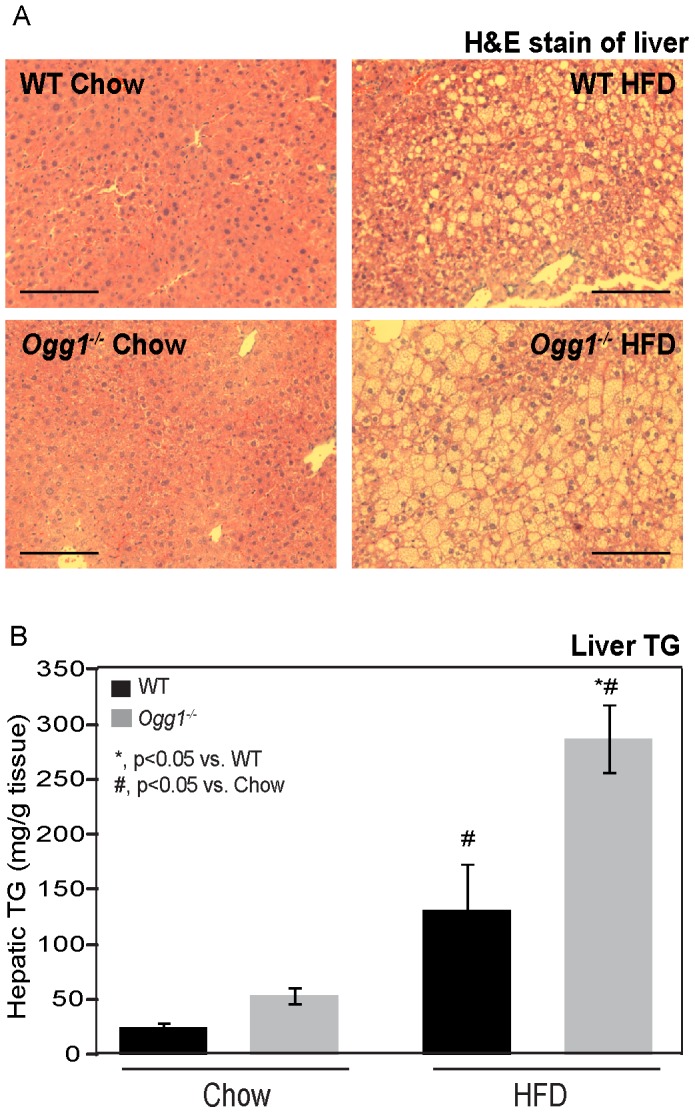
Hepatic lipids were visualized by H&E staining of formalin-fixed paraffin embedded liver tissues in chow- and HFD-fed animals (A). Images are representative of 3 animals per group. Bar represents 50 µM in all images. Hepatic triglyceride (TG) content (B) was quantified as described. n = 6 for each group; *, p<0.05 vs. WT, #, p<0.05 vs. chow-fed mice.