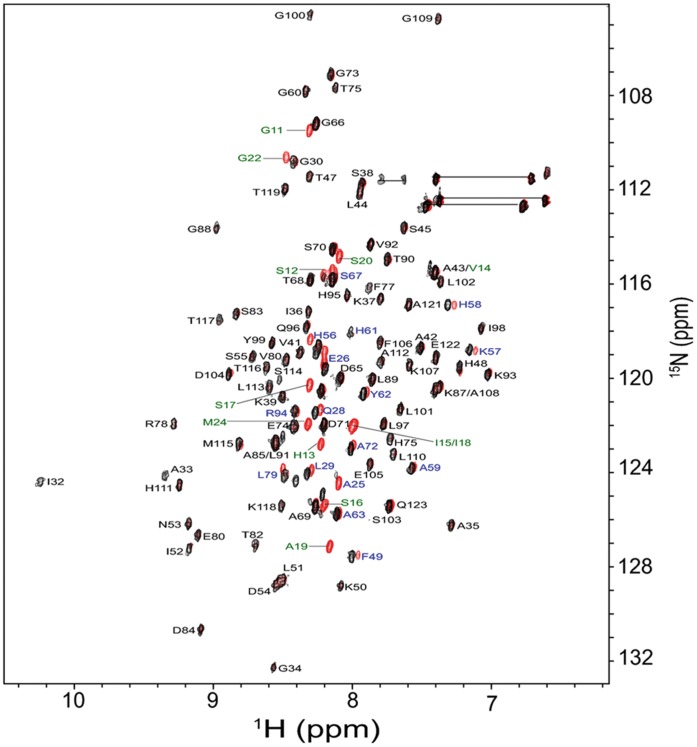
Figure 6. An overlay of 2D [15N-1H] HSQC spectrum of the complex (formed between u-15N-labelled UVI31+ and pyrenoids) (shown in black) with that of u-15N-labelled UVI31+ alone (shown in red).
Most red spots overlap with black spots in the spectrum (residues that do not change in the complex, also shown as black letter code of the amino acid residues). Signals of a few residues are lost in the complex (shown as green letter code of the amino acid residues). Signals of a few residues are shifted due to chemical shift perturbations (shown as blue letter code of the amino acid residues). The amine-group peaks from the side-chains of Asn and Gln appear as doublets near the top right corner of the spectrum as connected by horizontal lines. The experiments were recorded at pH 6.4 and 298 K. The spectra were recorded on Bruker Avance 800 MHz NMR spectrometer with 256 and 2048 complex points along t1 and t2 dimensions, respectively.

