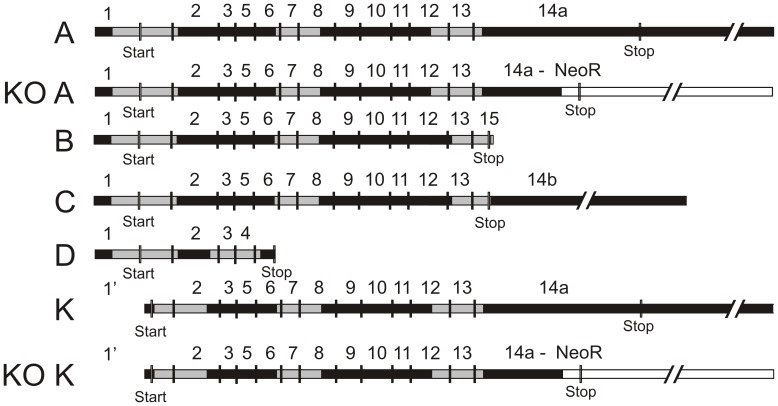
Figure 2. Gene map of the P2X7 receptor isoforms.
The map is made according to the NCBI reference sequences. Exons are numbered and start/stop codon are marked. The map illustrates the potential mRNA isoforms that detected in mouse PSCs. These are marked in light grey for both WT and KO samples. Expected KO isoform A and K hybrids are also depicted, with the NeoR cassette inserted in white and the inserted early stop codon labeled.

