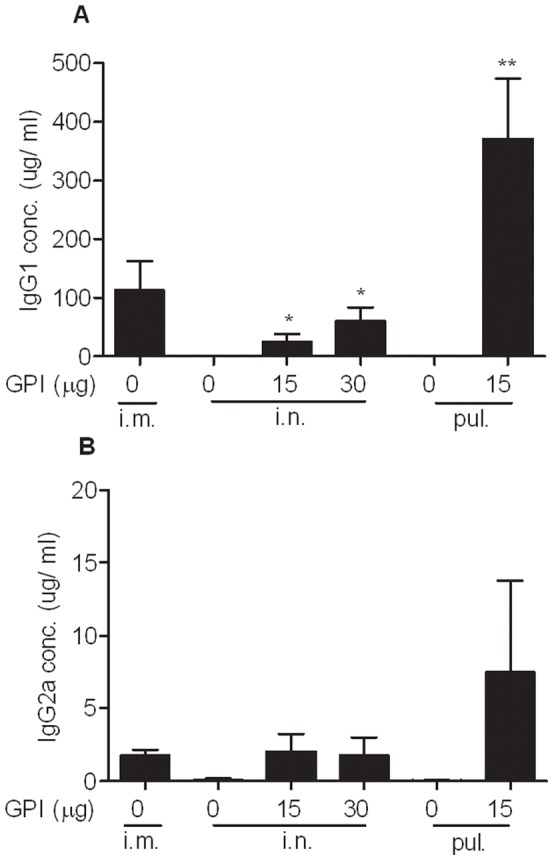
Figure 3. Phenotype of the influenza-specific antibody responses.

Serum samples from the mice described in the legend to Fig. 1 were collected on day 37. (A) Average quantities (µg/ml) of influenza-specific IgG1± S.E.M., n = 6 mice per group. (B) Average quantities (µg/ml) of influenza-specific IgG2a ± S.E.M.
