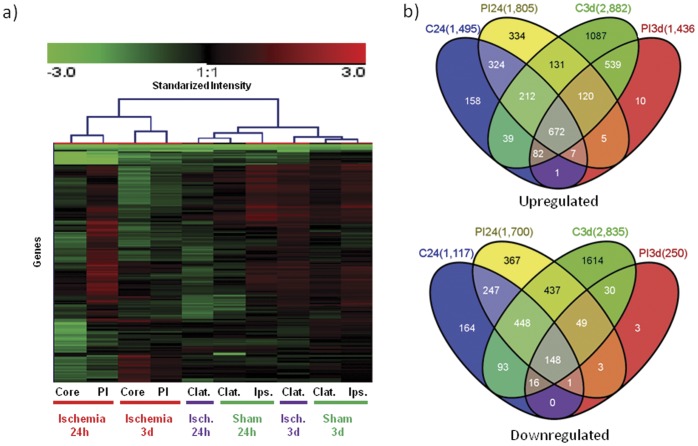
Figure 2. Focal cerebral ischemia induces early and delayed gene regulation with different patterns in core and periinfarct areas.
RNA was isolated (Qiagen RNeasy) and hybridized to Agilent chips (4×44 K). (a) Upper part of the Heat map of the genes with an at least 2-fold change in expression in at least one condition after 24 h and 3 d of permanent cerebral infarct vs. levels in healthy samples. Each experimental condition is given at the bottom. PI = Periinfarct area; Clat = Contralateral cortex; Ips = Ipsilateral area. Vertical “Y” axis shows individual genes. Red = Up; Black = no change; Green = down. (b) Venn diagrams of upregulated and downregulated genes showing differences between core (C) and periinfarct (PI) at 24 h and 3 days of ischemia compared with healthy individuals (logFC = |1|; P<0.05).

