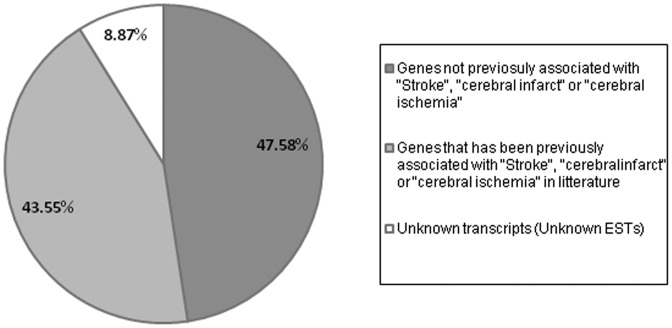
Figure 3. Microarray analysis leads to the identification of hundreds of genes not previously associated with stroke.
Pie-chart showing the percentage of genes already associated with stroke or cerebral ischemia, the percentage of genes that were not associated, and the percentage of EST’s identified in this study. Percentages were calculated from a list of 300 genes selected by chance from the output of Venn diagrams and considering all the experimental conditions (24 h, 3 d, core and periinfarct). (EST: Expressed sequence tag).

