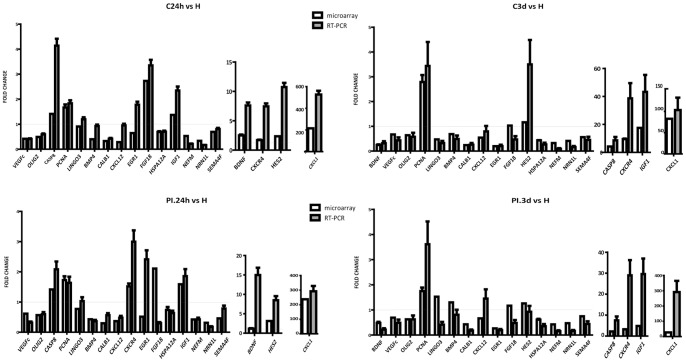
Figure 6. Validation of data from microarray analysis.
The levels of 19 representative genes were assessed by qRT-PCR in a new set of 12 animals. Values were normalized to GAPDH, PGK1 and HMBS control genes. Data represent the means ± SD of three independent experiments performed in triplicate. Differences with healthy animals were arbitrarily set to 1. All changes in gene expression were significant (P<0.01). Red line indicates FC = 1.

