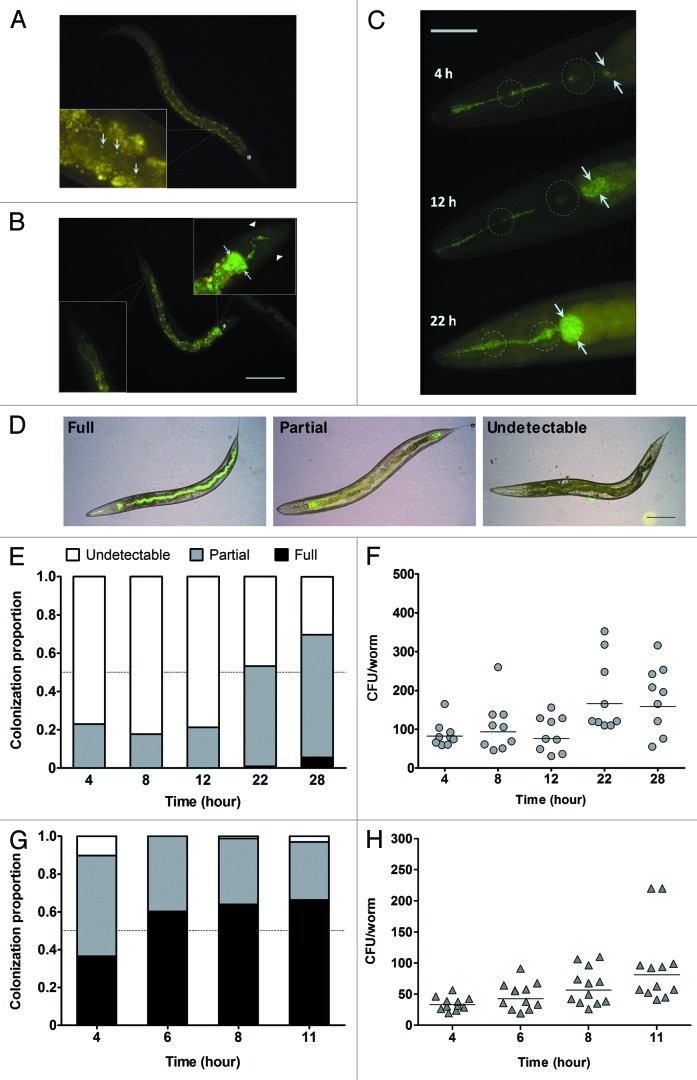
Figure 1. R15-GFP displayed limited intestinal lumen colonization during C. elegans N2 infection. (A) A low number of R15-GFP cells were present along the intestinal lumen after 4 h of infection. (B) At 28 h post-infection, the major portion of the worm intestinal lumen was void of R15-GFP except for the anterior intestine which was grossly colonized and distended. Note that the worm body shrunk and the nose was contracted at this time point. (C) Three representative worms here depict an increase in R15-GFP colonization within the anterior intestine upon prolonged pathogen exposure. After 22 h post-infection, both pharyngeal bulbs of the worm were distorted and contained proliferating bacteria. (D) Shown are the three categories of colonization criteria that were used to classify the infected worms. (E) Stacked bars correspond to mean proportion of the infected N2 population encompassing all three colonization categories (n = 75–100). (F) The graph shows the number of R15-GFP colonizing N2 worm intestines throughout the infection. (G) Stacked bars represent mean proportion of infected tnt-3(aj3) population within the three colonization categories (n = 75–100). (H) The graph shows the number of R15-GFP colonizing tnt-3(aj3) worms up to 11 h infection. (F and H) Each marker corresponds to the average bacterial CFU extracted from 10 infected worms; horizontal lines represent geometric means. Light blue arrows in (A–C) point either to individual R15-GFP cells or colonization as well as distension of the intestinal lumen. Asterisks in (A) and (B) mark the terminal pharyngeal bulb. Dotted circles in (C) mark the anterior and terminal pharyngeal bulbs. Images (A and B) were taken at 100× magnification while (C) was captured at 400x magnification. Scale bars in (B?D) represent 200 µm, 50 µm and 30 µm, respectively.

An official website of the United States government
Here's how you know
Official websites use .gov
A
.gov website belongs to an official
government organization in the United States.
Secure .gov websites use HTTPS
A lock (
) or https:// means you've safely
connected to the .gov website. Share sensitive
information only on official, secure websites.
