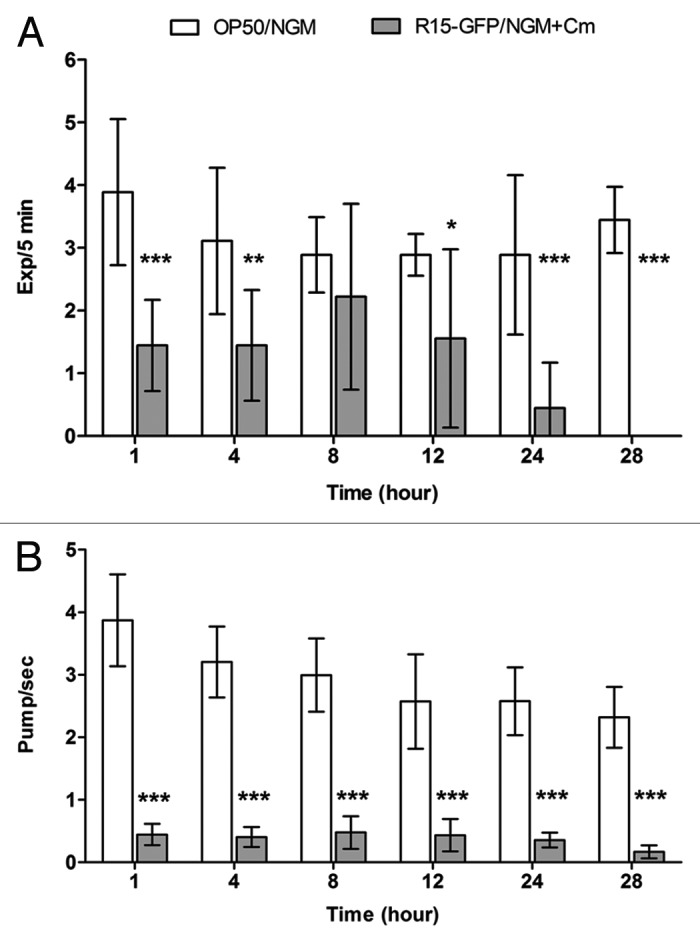
Figure 2.Bp R15 infection caused a significant reduction in both C. elegans defecation and feeding rates. (A) Bars correspond to mean ± SD of the frequency of Exp over 5 min per worm (n = 3). *p < 0.05,**p < 0.01, ***p < 0.001 (Mann-Whitney U-test). (B) Bars correspond to mean ± SEM of pharyngeal pumping per second for each worm (n = 30). ***p < 0.001 (Student’s t-test). Graphs (A and B) share the same labels, which are shown above (A).
